

Crude oil's downward slope persisted during the morning session in Asia, driven by ongoing concerns surrounding oil demand, increasing real interest rates, and constant apprehensions in the banking sector. However, technical charts indicate that oil is approaching crucial support levels, which could potentially lead to a temporary halt in the decline or even a minor rebound.

Early in the Asian morning, crude oil experienced a roughly 7% drop before stabilizing to some extent. This decline followed the U.S. Federal Reserve's decision to raise interest rates by 25 basis points. The tightening of monetary policy has resulted in U.S. real interest rates reaching multi-year highs, with the 10-year real rate recently hitting a 15-year peak before retracting slightly, as indicated by data from the Federal Reserve Bank of Cleveland. Academic studies have shown an inverse correlation between real interest rates and oil prices.
Concerns regarding oil demand amidst a slowing global economy have overshadowed the surprise announcement of production cuts by OPEC+ countries in April. The global growth outlook has deteriorated over the past year, despite the recent modest upgrade, with the median consensus for world GDP in 2023, according to Bloomberg, at 2.5% year-on-year compared to 3.6% in early 2022.
The International Energy Agency predicts that China's oil demand will account for around 90% of the growth in demand. However, the unexpected contraction in China's manufacturing activity in April indicates an uneven post-Covid recovery.
Charts Created by Manish Jaradi Using TradingView
Crude Oil Daily Chart
Last week, worries regarding the US banking sector resurfaced as First Republic's stock plummeted due to a significant decline in deposits, surpassing expectations. This development led US regulators to intervene and seize control of the institution on Monday, making it the third major US bank failure within a two-month period. Additionally, reports of PacWest Bancorp contemplating strategic alternatives, including a potential sale, caused shares of US regional banks to decline during after-market trading.
Crude Oil Daily Chart
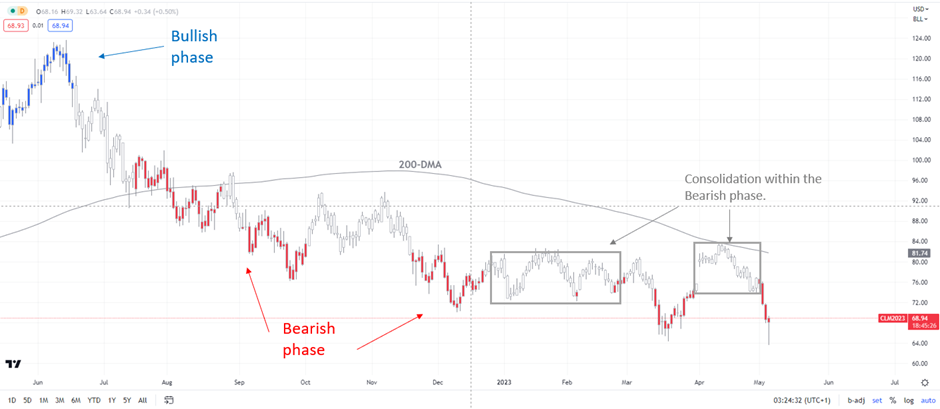
Based on technical analysis charts, crude oil has returned to a bearish phase since mid-2022, as evidenced by color-coded candlestick charts that reflect trending and momentum indicators. Recent updates (April 10, April 13, and April 26) have highlighted a consolidation period despite the efforts of OPEC and its allies to reduce output through cuts made in April.
outcome will largely depend on how the price behaves over the remaining two days of the week. If a similar pattern forms at the end of Thursday, followed by a higher closing price on Friday, it could instill confidence among bullish traders. Nevertheless, unless the resistance levels between 82.00 and 84.00 are breached, the prevailing trend for oil is expected to be sideways or downwards. In case the price falls below the March low of 64.10, there is further support at the August 2021 low of 61.75, followed by the March 2021 low of 57.25.
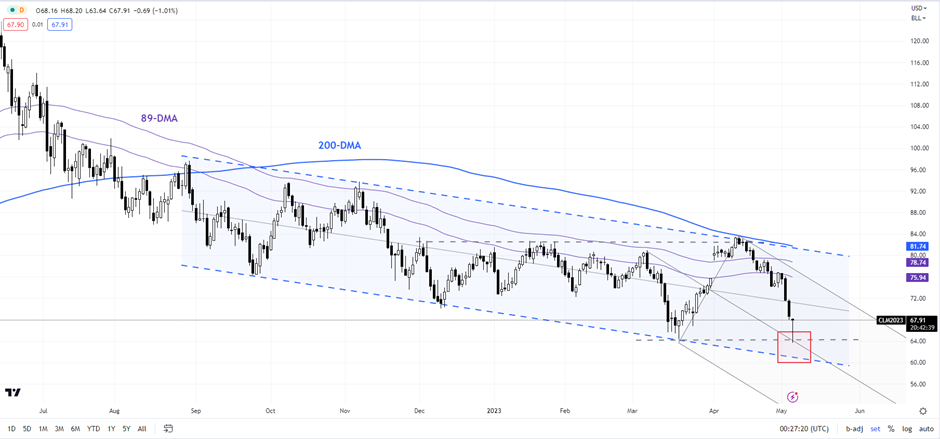
Crude oil is currently undergoing a critical test of significant converging support levels, including the 200-week moving average, the March low, and the median line of a descending pitchfork channel established since early March. Although the price movement is still unfolding, it is worth noting that the 14-week Relative Strength Index (RSI) has not reached a new low despite oil prices approaching the March low. This divergence between price and momentum indicators suggests that the downward momentum of the slide may be weakening.


