
The euro's upward momentum has been temporarily halted due to overbought conditions, stretched positioning, and uncertainties surrounding the US Federal Reserve's potential pause in its upcoming meeting. Although the outlook varies for different currency pairs, the retreat in the euro's value does not necessarily indicate an end to the uptrend in EUR/USD.

The rate at which EUR/USD has been climbing in recent months has been notably rapid, with the six-month change being the highest since at least 2017. While this strong momentum is promising for the medium-term outlook, there is a likelihood that in the near-term, the pace of gains may slow down or even reverse to some extent. This is expected due to the mean-reverting nature of the series, as indicated in the chart. The current drop in the EUR/USD pair could be seen as an early indication of this potential reversal.
EUR/USD – 6 months change
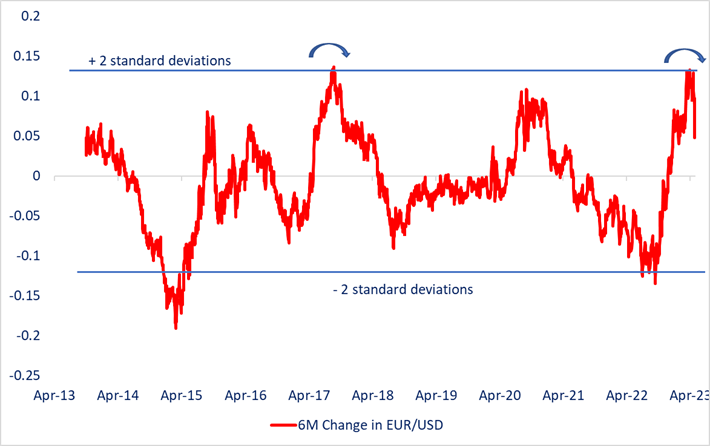
Source Data: Bloomberg
Speculative positions betting on the appreciation of the euro have reached their highest level since 2020, positioning the single currency as overcrowded within the major currency space. This is indicated by the chart.
Additionally, macroeconomic data from the Euro area has been disappointing since early February, indicating that the impact of European Central Bank (ECB) rate hikes is gradually affecting the economy. Yesterday's released data revealed a larger-than-anticipated decline in Euro area industrial output in March, primarily driven by a drop in the production of capital goods.
Despite these developments, the ECB maintained a hawkish stance in its recent meeting earlier this month. Money markets are also pricing in the possibility of two more rate hikes by October.
Recent statements from the US Federal Reserve have exhibited a more hawkish tone, causing a reevaluation of the expected pause in monetary policy at the June meeting. Market indicators, such as the CME FedWatch tool, now suggest a 20% probability of a 25-basis point rate hike at the June meeting, which has increased from 15% compared to a week ago.
EUR/USD Daily Chart
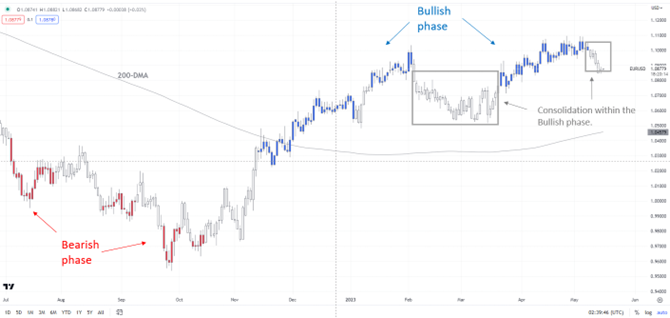
Chart Created by Manish Jaradi
Based on the color-coded candlestick daily charts, which indicate trends and show market movements, it can be observed that EUR/USD has entered a period of consolidation within the larger uptrend. This consolidation phase was previously identified as a potential risk in the previous update.
The decline of EUR/USD below a minor support level at the early-May low of 1.1000 suggests a decrease in upward momentum. However, there is a significant and converging support zone formed by the 89-day moving average and the lower boundary of the Ichimoku cloud on the daily chart. This support zone provides a substantial level of resistance to further downward movement. Furthermore, a stronger support level can be found at the March low of 1.0510, providing an even more substantial cushion for potential declines in EUR/USD.
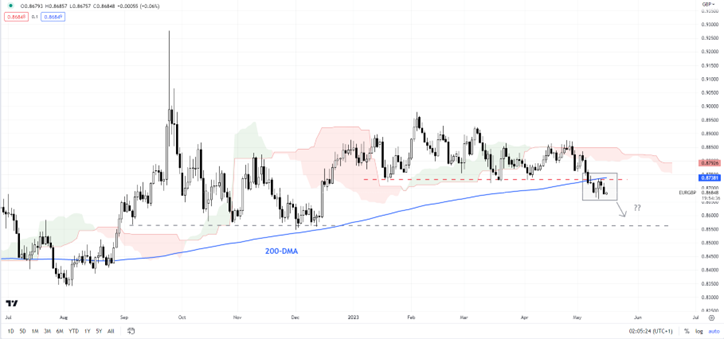
The breach of a significant horizontal trendline support around 0.8725 in EUR/GBP has resulted in a breakout from a sideways trading pattern that lasted for several weeks. This breakout has cleared the path for a potential decline towards the December low of 0.8545 in EUR/GBP.
EUR/JPY 240-minute Chart
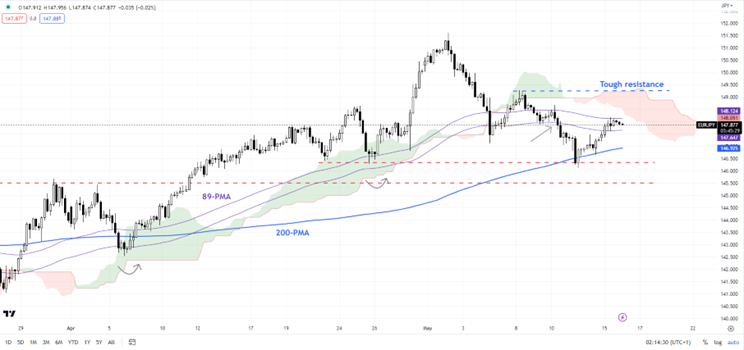
Chart Created by Manish Jaradi
The decline of EUR/JPY below the crucial support level formed by the 89-period moving average and the Ichimoku cloud on the 240-minute chart verifies a decrease in the previous upward pressure. This suggests that the current trend has lost some strength. If the late-April low of 146.25 is decisively broken, it would confirm a shift in the trend from sideways to a slight downtrend.
On the upside, EUR/JPY may encounter difficulty in surpassing the resistance at the May 8 high of 149.25.


