
As risk sentiment continues to influence the pricing of gold, the precious metal stabilized around the US$ 2,020 mark at the start of Tuesday’s (9th May) trading session following a dip last Friday. Treasury yields have increased across the curve since the Federal Open Market Committee (FOMC) announced a 25-basis point hike to its target rate, which is now at 5-5.

Last Thursday (4th May), the 2-year note benchmark hit a low of 3.66%. However, it has since increased to 4%.
While Treasury yields bounced back from their lows, gold reached a 33-month high of US$ 2,085.4 on the COMEX futures exchange. However, it has since declined.
Recently, real yields have shown an inverse correlation with gold prices. The 10-year rate rose to 1.29% overnight, which is significantly higher than the low of 1.11% seen last week. The real yield is calculated by subtracting the market-priced inflation rate derived from Treasury inflation-protected securities (TIPS) from the nominal yield for the same duration.
The market is awaiting Wednesday's US CPI data to gauge the Fed's rate trajectory, and WTI crude oil reflects this inverted price movement.
According to a Bloomberg survey of economists, headline inflation is expected to reach 5.0% year-on-year until the end of April. As gold prices decline, volatility has also reduced. The GVZ index measures gold volatility in a comparable manner to the VIX index, which measures volatility on the S&P 500.
Gold has been trending upwards since November of last year, remaining within an upward trending channel. Although last week's high of 2085.4 surpassed the March 2022 peak of 2078.8, it was unable to surpass the all-time high of 2089.2. This suggests that the area between 2080 and 2090 could be a zone of resistance. If gold surpasses this zone, it may be possible to test the ascending trend line, which is currently intersecting at 2130.
For a bullish Triple Moving Average (TMA) pattern, the price must be higher than the short-term Simple Moving Average (SMA), the short-term SMA should be higher than the medium-term SMA, and the medium-term SMA should be higher than the long-term SMA. Additionally, all SMAs should have a positive slope.
This week's price movement resulted in the 10-day SMA rising above the 21-day SMA and the 200-day SMA rising above the 260-day SMA, which are referred to as Golden Crosses.
The recent change in the Simple Moving Averages (SMAs) of gold price action has led to the fulfillment of the requirements for a bullish Triple Moving Average (TMA) pattern, where the short-term SMA is above the medium-term SMA, which is above the long-term SMA, and all have a positive slope. However, if the price closes below any of these SMAs, the TMA pattern would no longer be valid.
On the downside, if the price falls, it may find support at the previous lows of 1980.9, 1945.0, and 1936.5, followed by the ascending trend line that is currently situated at 1915. Additionally, the 100-day SMA near the trend line could act as a supportive level.
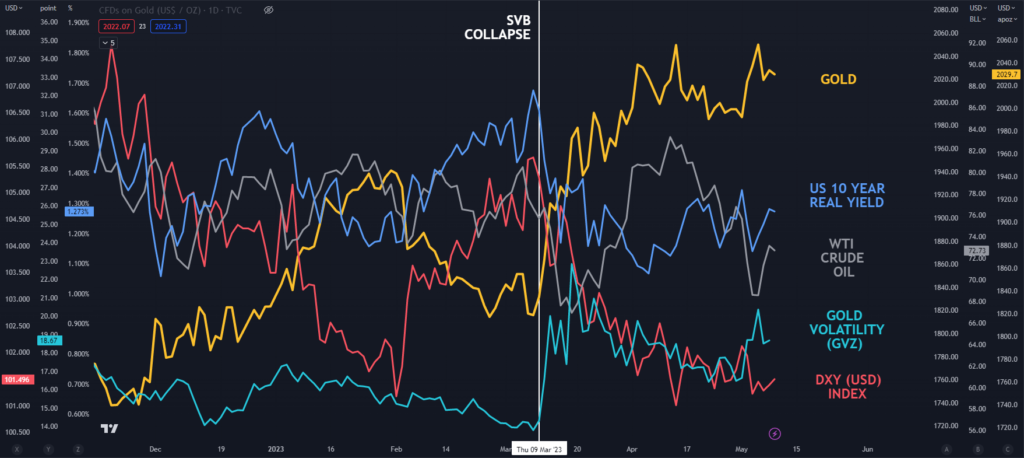
GC1 (GOLD FUTURES) WTI CRUDE OIL, US 10-YEAR REAL YIELD, GOLD VOLATILITY, USD


