
The Fibonacci series has taken on a mythical status in recent times. The sequence was always associated with great works of art. In the competent hands of traders, the wizardry of the sequence is used to speculate the future value of a stock, commodity or currency. In this article we will understand the application of Fibonacci analysis to the stock market.

Side-note: the analysis can be used in charts representing the valuation of currencies or commodities as well.
What Is Fibonacci Series And What Are Fibonacci Retracements?
Market trends are similar to repeating patterns in nature. Hence, their relationship with the Fibonacci sequence is also of a similar kind. Although the exact reason for these repeating patterns in trading markets is not known, it does not stop technical traders from using Fibonacci retracements to predict the momentum of stock prices.
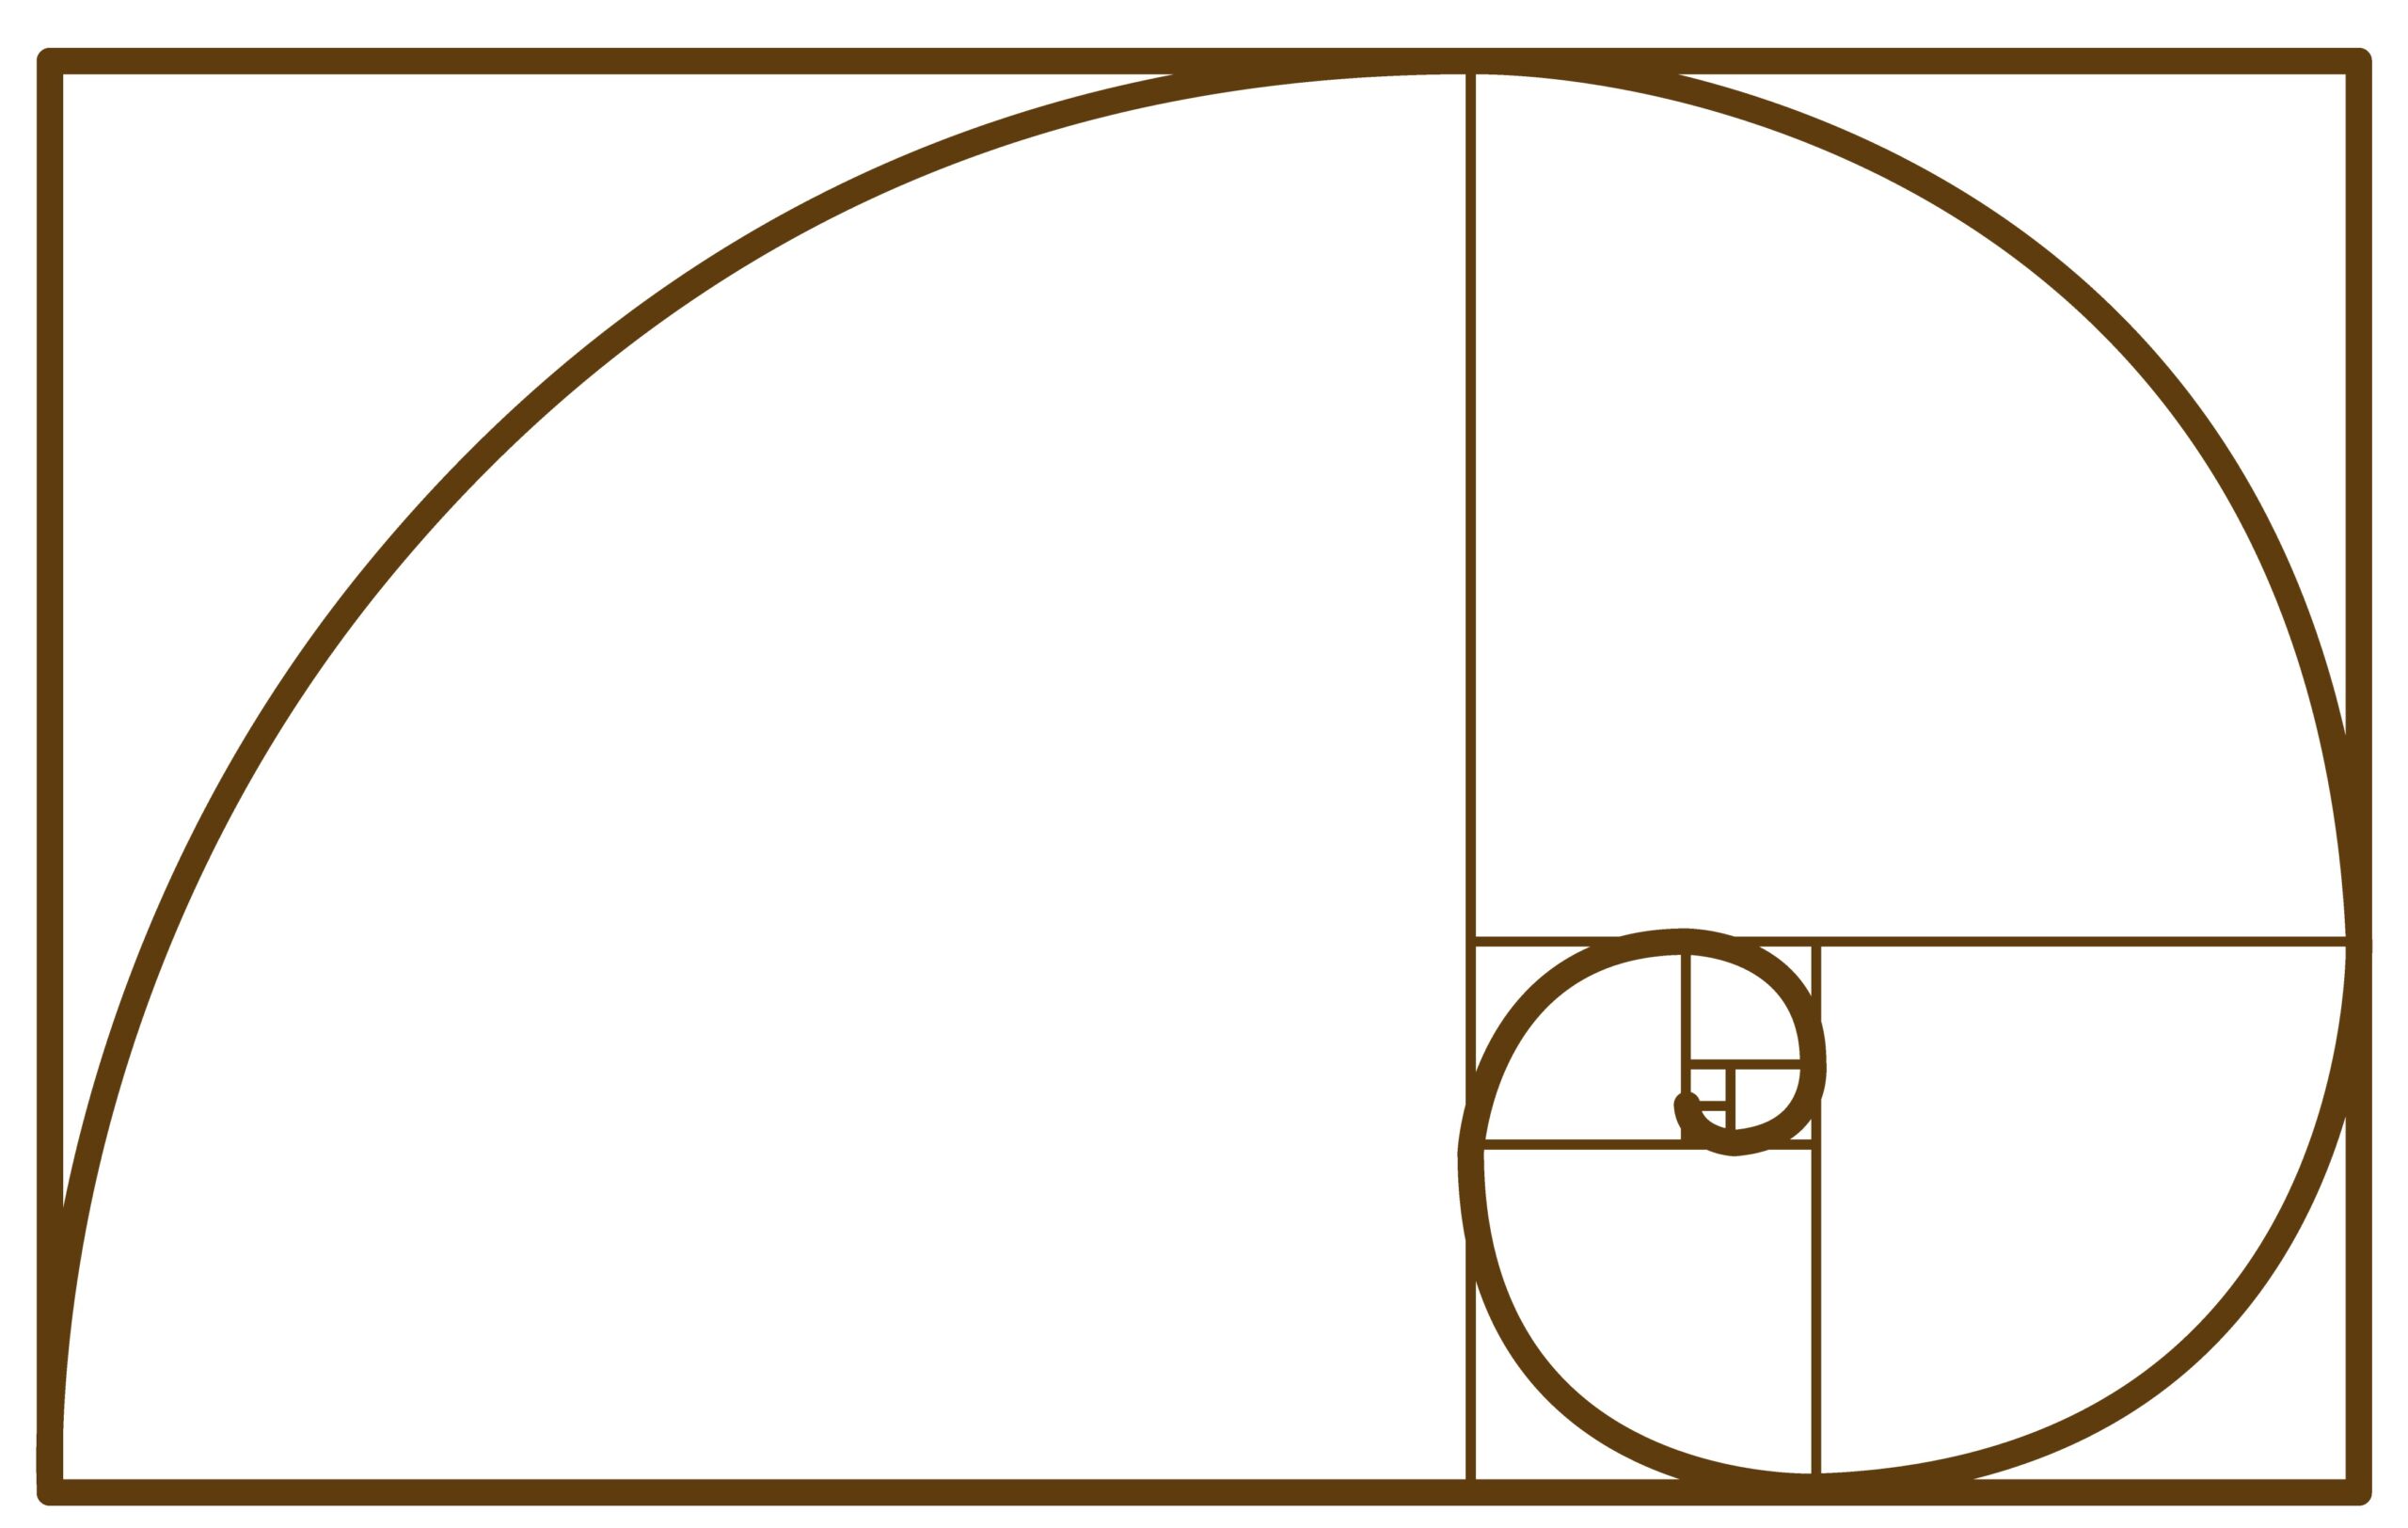
The Fibonacci series was discovered by a twelfth-century monk Leonardo de Pisa, who was later given the nickname Fibonacci. The series is a sequence of numbers which looks like this: 1,1,2,3,5,8,13,21,36, and so on.
Each number in the series is the sum of the preceding two numbers.
1 + 1 = 2
2 + 1 = 3
3 + 2 = 5
5 + 3 = 8
So on and so forth.
This series has certain properties that make it a useful tool in mathematics. The ratios of the numbers of the Fibonacci series keep repeating. For example, the ratio of 13 and its preceding number 8 is 1.618.
Similar ratios keep repeating throughout the series. Like, if you divide 5 by 8 you get 0.6176.
These ratios are called Fibonacci retracements. The retracements levels 0.386, 0.5 and 0.618 are generally enough to analyze a stock trade. In periods of high volatility, 0.214 and 0.786 levels are also used to better predict the behavior of the stock prices.
Note:0.5 is not a Fibonacci retracement ratio. It is added by traders to mark the momentum of the asset price. The momentum describes an upwards or downward trend.
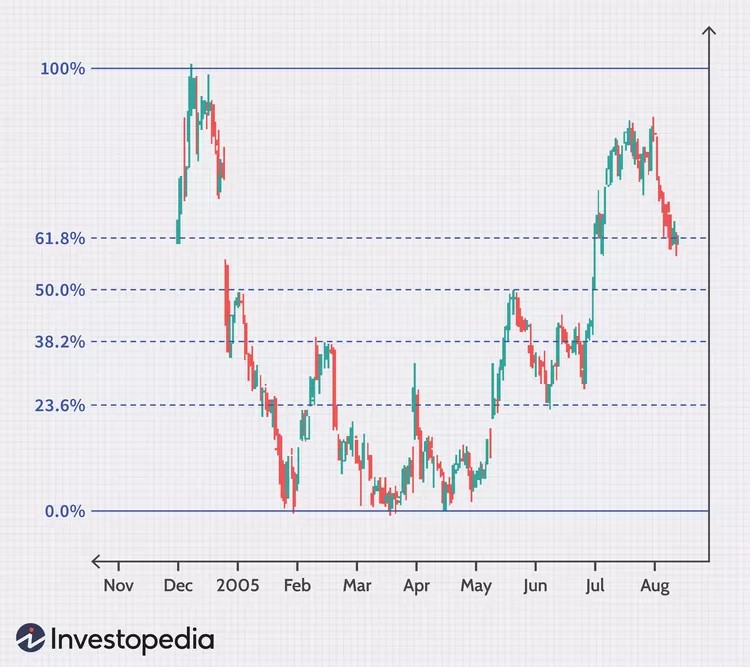
(Source: Investopedia)
A sequence of Fibonacci retracements have been plotted on the graph here. The ratios have been represented as percentages, a common practice in mathematics.
When Do Traders Use Fibonacci Retracements?
Traders use Fibonacci retracements to make a long-term analysis of stock prices. This form of technical analysis is not used by day traders. Fibonacci retracements are more effective when an asset’s price across a month is plotted on a chart.
Fibonacci retracements inform their decision about an asset. If they’re holding a long position, Fibonacci retracements help them predict the bullish trends of the asset.
Trade analysts pick two prominent points on the chart, one high and one low as the support and resistance points. They then trace vertical lines to mark key Fibonacci retracement ratios. Horizontal lines are then drawn on this chart to identify specific trading opportunities based on the strategy of the trader.
If you plan to use Fibonacci retracements as a technical tool to analyze and plan your trades then it is important to conduct the above exercise just like the traders. Once you have the chart with all the ratios plotted, you will have to learn to spot the upward and downward trends.
Upward And Downward Trends
In order to spot these trends, look at the annual performance of an asset. Let us assume that a stock shows an overall upward trend as shown in the chart below.

In this upward trend, the Fibonacci ratios will help you mark the lows and smaller downward trends. Using this analysis, you can select the entry point for trading on the asset depending on your position. If you’re taking a long position, then identifying the support point of a downward trend will give you the most profitable trade.
Based on this form of technical analysis there are a few common strategies that traders employ to make their trades profitable. Fibonacci retracements themselves are tools that have to be used with the framework of these strategies.
Using The Fibonacci Flush Strategy
In this strategy, instead of using a single grid of Fibonacci retracements, asset price is analyzed over multiple time frames. So you take charts of a stock price over the course of an hour, day, week, or a month. You make the grid as mentioned above on all of them.
If you’re a swing trader, then focus on the 60-minute chart and the daily chart to find hidden support and resistance trends in the asset price.
If you’re a market timer, use the charts with a longer view of the asset price to make your speculations.
There are two points you should spot while employing this strategy:
- Possible entry points when the trend of the stock will change.
- Possible exit points to make the trade profitable or to stop loss.
To maximize the impact of this strategy it is important to find points that are missed by other traders. It is important that you identify these points as quickly as possible and make your trade because other traders are looking at such opportunities and their actions will change the trend immediately.
Working example:
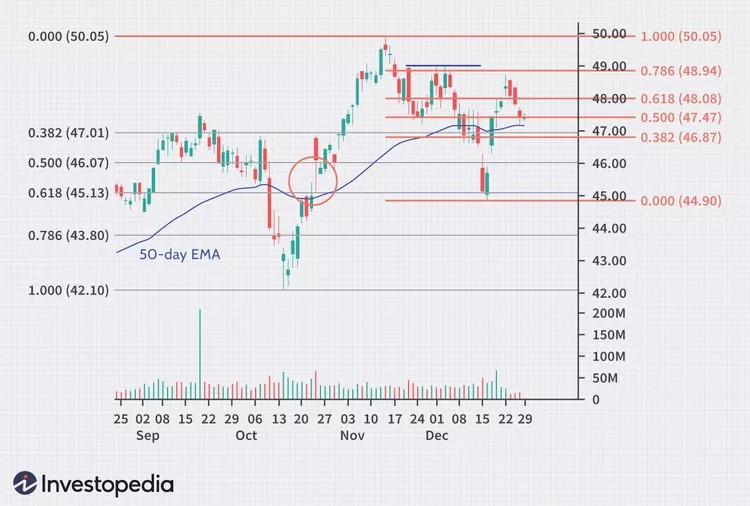
(Example Chart 1)
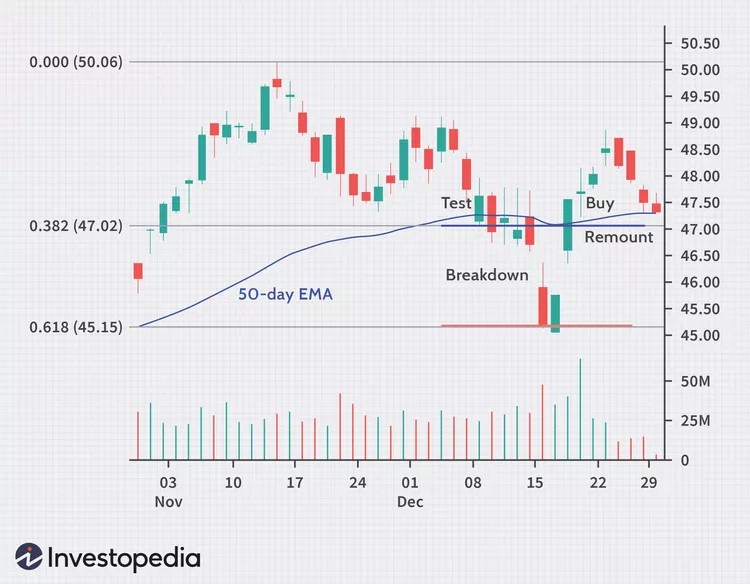
Example Chart 2
In the chart 1 given above let us find the support and resistance points that other traders will find difficult to spot. The chart depicts the price points of Microsoft Corporation shares over the span of four months.
After a deep low of $42.10 in October, the stock price recovered and reached a peak of $50.5 within a few weeks. These two points become our top and bottom points for our Fibonacci retracements.
We then zoom in on smaller section, as show in chart 2, to predict new support and resistance levels over a shorter time frame.
The falling price follows the 38% retracement line for four sessions as traders sink their capital in the stock, waiting for the reversal. The stock price drops as the capital runs out of steam and traders begin to exit the stock. The loss gap touches the 0.68 retracement line on the chart. Here it can get tempting to buy the stock. However, a Fibonacci buy signal is given after a trading gap when the stock recovers at the 38% retracement line once again. The stock price at this point is $47 and this should be your entry point for the stock. You cannot expect the stock prices to surge again in the near future. The traders that booked a loss on the stock during the downward trend will hesitate to reinvest. However, support surge generally holds the stock price steady so you can easily book your profits when the stock price reaches the $47.5 mark.
This is the Fibonacci flush strategy in action. You can use this strategy to analyze the chart of any financial assets, from commodities to cryptocurrencies.
The Parabola Pop Strategy
Study the chart and the grid given above to understand the parabola pop strategy. Notice how the asset price oscillates around the 0.618 retracement line. This line is the harmonic barrier between a stock and its journey to a 100% price swing.
As a trader, you can predict that a breakout on this line will take the stock price to its old high while a breakdown at this point will start a sharp downward trend.
When the stock touches the harmonic line you will get a strong Fibonacci buy signal. You can book profits by taking either a long or short position on the basis of the immediate momentum of the stock price. This is the parabola pop strategy.
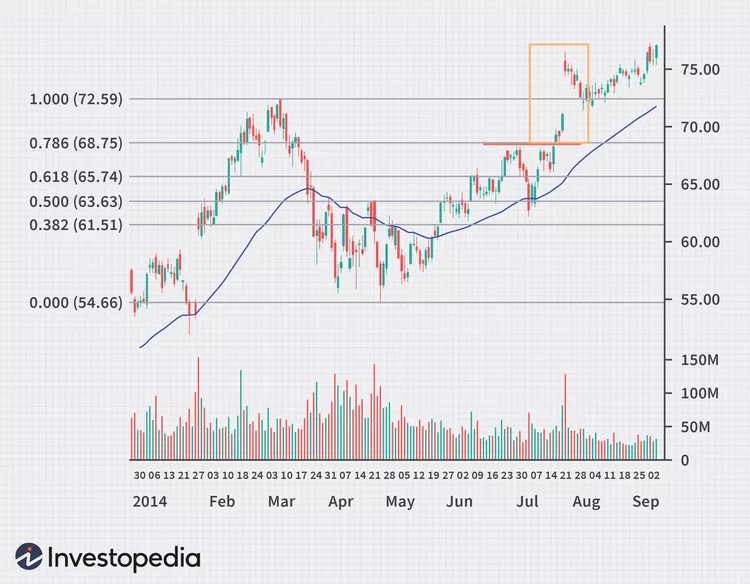
Fibonacci traders used this strategy to predict the price points of Facebook/Meta shares in 2014. The share price had peaked at $72.5 and found support after a breakdown in the mid-fifties. The subsequent bounce in the share price touched the 78.6% retracement line at a price of $68.75. The share price stayed along this harmonic barrier line till July before a breakthrough trend led it to the 100% peak price point. Fibonacci traders got strong buy signals when the stock touched the harmonic barrier at $68.75 and booked 21.4% profit when the stock price reached the peak point.
The Limits Of Fibonacci Retracements.
Using technical analysis of any kind to predict asset prices has been described as driving a car using only the rearview mirror. Do not speculate on asset prices using this tool only. A tool is only as effective as the person wielding the tool.
So, you should look at the macroeconomic trends that might affect the asset price as well, while making speculations.
Bear in mind that every tool has its scope and limitations. Despite its mythical status, Fibonacci retracements are not magic wands waiting to demystify market forces for you. Use it as a tool only to further a thought-out investment strategy with proper risk mitigation.


