
The recent breakthrough of the British pound against the US dollar suggests that there could be a change in the currency pair's medium-term performance. GBP/USD hit a one-year high before the Bank of England's interest rate decision on Thursday (4th May), despite the US April jobs report being better than expected, as there were downward revisions to March's job numbers. As such, the market is still expecting the Fed to cut rates by 75 basis points by the end of the year. The BOE is anticipated to increase interest rates by 25 basis points to 4.5% due to persistent UK inflation pressures, with March's on-year headline inflation rate rising faster than expected at 10.1%. The market is expecting a terminal rate closer to 5%, and a hawkish rate hike could lead to a higher GBP value.

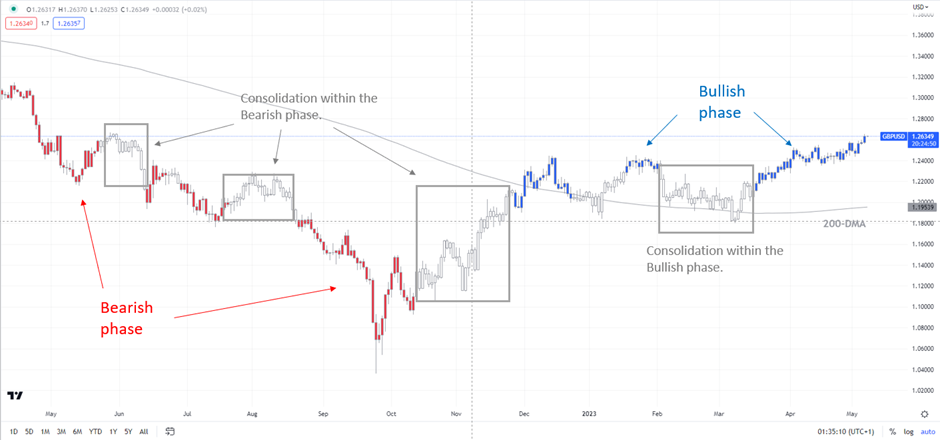
Chart Created by Manish Jaradi
In addition, the UK's macroeconomic data has been better than expected in recent weeks, as shown by the UK Economic Surprise Index which is at a two-year high. In contrast, the US Economic Surprise Index has been declining since the end of March. The upcoming US CPI data, which is expected to show a softening in core CPI from 5.6% in March to 5.5% in April, will be crucial following the US Federal Reserve's interest rate hike last week and their indication of a potential pause.
Since the market does not expect any rate cuts by the BOE this year, the relative monetary policy outlook is currently supporting the GBP.
GBP/USD Daily Chart
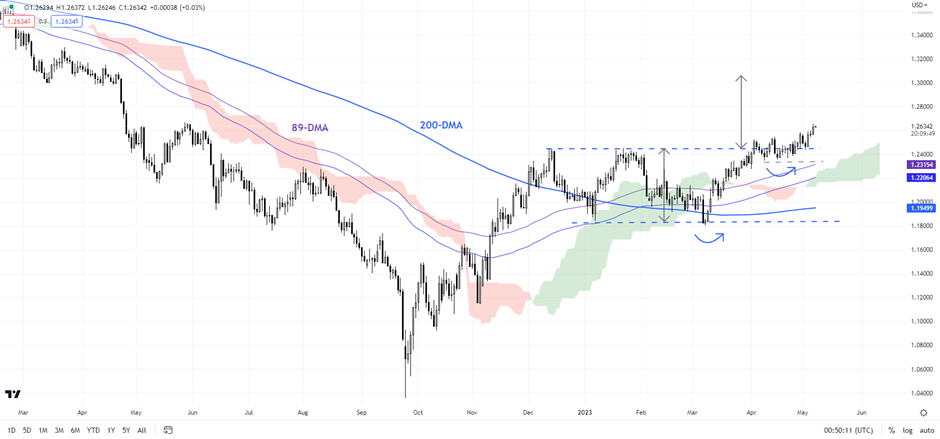
Chart Created by Manish Jaradi
According to technical analysis, the British pound's recent rise against the US dollar has broken above a horizontal trendline from the end of 2022 at about 1.2450. This has triggered a breakout from a sideways channel, which suggests that GBP/USD could potentially rise toward 1.3000-1.3100 based on the width of the pattern. Last week's rise confirms the higher-tops-higher-bottom sequence since late 2022. Furthermore, this could be more than just a corrective rebound and may open the door for a reversal of GBP/USD's medium-term downtrend, which was first highlighted in October.
GBP/USD Weekly Chart
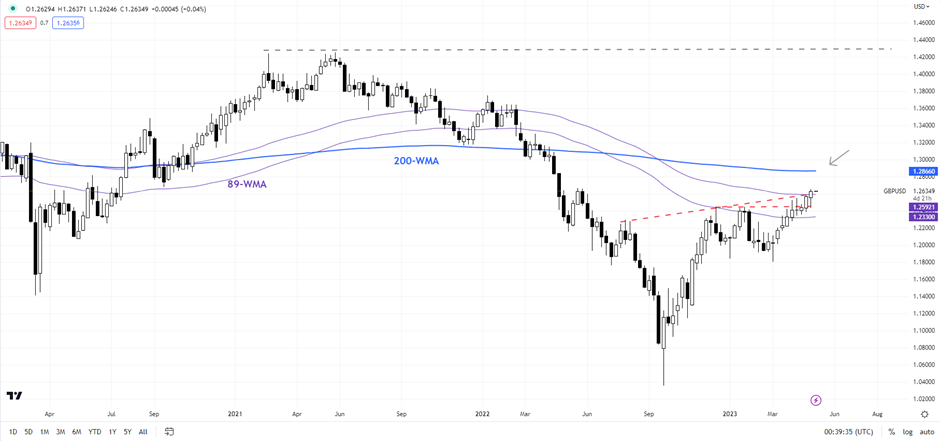
The recent trend for GBP/USD has been bullish, as indicated by colour-coded candlestick charts based on trend and momentum indicators. This is further supported by the fact that GBP/USD has risen above the upper edge of the Ichimoku channel on the weekly charts. Currently, the pair is facing a tough obstacle at the 89-week moving average, which was last decisively surpassed in 2021. If GBP/USD can break through this resistance, the next barrier will be at the 200-week moving average, around 1.2870.
In terms of downside support, the mid-April low of 1.2350 could provide a substantial cushion in the event of a pullback. A break below this level would be necessary for the upward momentum to weaken in the short term.


